The Bottom Line
When you need to precisely control a particular feed during fermentation, use gravimetric (weight-based) feeding.
The Challenge
Peristaltic pumps serve as the industry standard for fluid transfer in bench and pilot-scale operations. Their primary advantage is that liquid contacts only the tubing, preventing cross-contamination and maintaining sterility within the fermenter.
Many peristaltic pumps feature totalizers that track cumulative fluid volume transferred over time. This enables volumetric feeding during fermentation by monitoring raw values or plotting trendlines to determine feed rates. The totalizer calculates cumulative volume by multiplying calibrated volume-per-revolution by total pump revolutions.
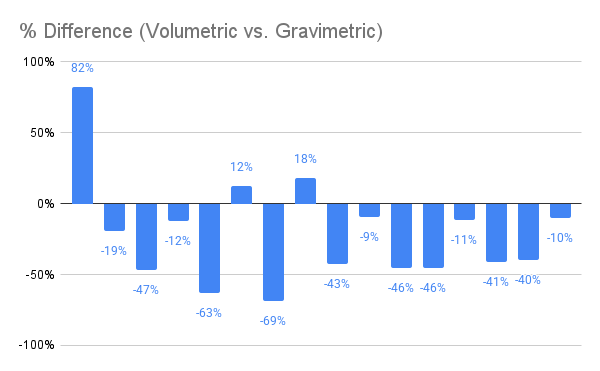
However, totalizers frequently deviate from actual volume under real-world conditions, sometimes significantly. Batch-to-batch variability may stem from measurement issues rather than process problems. Common causes include:
- Pump cycling on and off. At low feed rates, peristaltic pumps may cycle intermittently to approximate target flow rates rather than running continuously. Small deviations accumulate over lengthy fermentations.
- Backpressure from the vessel. Even minimal vessel pressure forces the pump to work against resistance, typically reducing actual flow rate relative to totalizer readings, unless calibration occurred under pressure, which rarely happens in practice.
- Air bubbles in the tubing. Air bubbles are nearly impossible to eliminate and are compressible. When pumps compress air bubbles, they displace less fluid than fully primed strokes, causing the totalizer to overcount actual volume.
- Worn pump heads and drive couplings. Over time, peristaltic pump heads and their drive couplings deteriorate. Worn heads may allow fluid backflow between strokes, and worn couplings introduce rotational inconsistencies, both degrading totalizer accuracy.
- Tubing fatigue. Repeated compression cycles cause peristaltic tubing to stretch and permanently deform. Geometric changes reduce volume delivered per revolution, decreasing totalizer reliability.
These factors can compound, making volumetric feeding increasingly unreliable as equipment ages or process conditions shift.
The Impact
Process impacts from overfeeding or underfeeding range from minor to severe depending on specifics. Minor effects include slightly overfeeding carbon sources like glucose or glycerol, resulting in less efficient fermentation. Severe consequences involve significantly overfeeding inducers such as methanol, potentially causing toxicity and cell death. When over or underfeeding reflects measurement artifacts rather than true process variables, diagnosis becomes extremely difficult and correction even harder.
The Solution
Growth Curve Bio employs gravimetric feeding for critical feeds including carbon sources and inducers. By positioning feed vessels on calibrated scales and monitoring mass changes over time, the company measures what actually gets fed, independent of pump speed, backpressure, air bubbles, or equipment degradation.
Gravimetric feeding gains further strength when paired with offline analytics. Measuring residual glucose, glycerol, or methanol during batches enables real-time feed rate adjustments based on actual fermenter conditions.
For pH control via base additions, gravimetric feeding proves useful but not typically essential. A well-calibrated automated pH controller can reliably maintain setpoints independently. Starting and ending base mass can then be measured offline for batch comparisons. When base consumption rate serves as a critical in-process indicator, gravimetric feeding becomes recommended.
By integrating gravimetric feeding with offline analytics, GCB operates precisely controlled processes while delivering valuable, actionable insights for understanding and continuously enhancing fermentation performance.
The Data